1005 Cecile Ave | Delano, California 93215
Key findings about U.S. immigrants

The U.S. has more immigrants than any other country in the world. Today, more than 40 million people living in the U.S. were born in another country, accounting for about one-fifth of the world’s migrants in 2015. The population of immigrants is also very diverse, with just about every country in the world represented among U.S. immigrants.

View interactive charts and detailed tables on U.S. immigrants.
Pew Research Center regularlypublishes statistical portraits of the nation’s foreign-born population, which include historical trends since 1960. Based on these portraits, here are answers to some key questions about the U.S. immigrant population.
How many people in the U.S. are immigrants?
The U.S. foreign-born population reached a record 43.2 million in 2015. Since 1965, when U.S. immigration laws replaced a national quota system, the number of immigrants living in the U.S. has more than quadrupled. Immigrants today account for 13.4% of the U.S. population, nearly triple the share (4.7%) in 1970. However, today’s immigrant share remains below the record 14.8% share in 1890, when 9.2 million immigrants lived in the U.S.

What is the legal status of immigrants in the U.S.?

Most immigrants (76%) are in the country legally, while a quarter are unauthorized. In 2015, 44% were naturalized U.S. citizens.
Some 27% of immigrants were permanent residents and 5% were temporary residents. Another 24% of all immigrants were unauthorized immigrants in 2015. From 1990 to 2007, the unauthorized immigrant population tripled in size – from 3.5 million to a record high of 12.2 million. During the Great Recession, the number declined by 1 million and since then has leveled off. In 2015, there were 11 million unauthorized immigrants in the U.S., accounting for 3.4% of the nation’s population.
The decline in the unauthorized immigrant population is due largely to a fall in the number from Mexico – the single largest group of unauthorized immigrants in the U.S. Between 2007 and 2015, this group decreased by more than 1 million. Meanwhile, this decline was partly offset by a rise in the number from Central America, Asia and sub-Saharan Africa.
Do all lawful immigrants choose to become U.S. citizens?
Not all lawful permanent residents choose to pursue U.S. citizenship. Those who wish to do so may apply after meeting certain requirements, including having lived in the U.S. for five years. In fiscal year 2016, 971,242 immigrants applied for naturalization. The number of naturalization applications has climbed in recent years, though the annual totals remain below those seen in previous years.
Generally, most immigrants eligible for naturalization apply to become citizens. However, Mexican lawful immigrants have the lowest naturalization rate overall. Language and personal barriers, lack of interest and financial barriers are among the top reasons for choosing not to naturalize cited by Mexican-born green card holders, according to a 2012 Pew Research Center survey.
Where do immigrants come from?
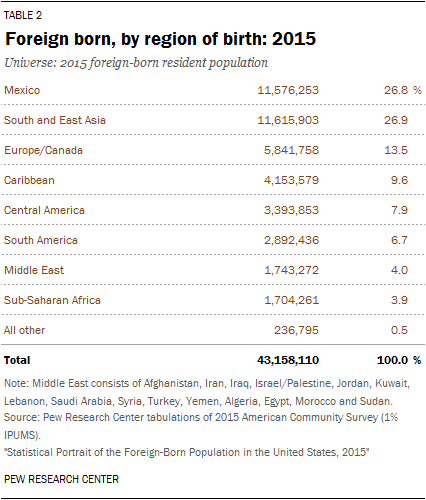
 Mexico is the top origin country of the U.S. immigrant population. In 2015, 11.6 million immigrants living in the U.S. were from there, accounting for 27% of all U.S. immigrants. The next largest origin groups were those from China (6%), India (6%), the Philippines (5%) and El Salvador (3%).
By region of birth, immigrants from South and East Asia combined accounted for 27% of all immigrants, a share equal to that of Mexico. Other regions make up smaller shares: Europe/Canada (14%), the Caribbean (10%), Central America (8%), South America (7%), the Middle East (4%) and sub-Saharan Africa (4%).
Who is arriving today?

About 1 million immigrants arrive in the U.S. each year. In 2015, the top country of origin for new immigrants coming into the U.S. was India, with 110,000 people, followed by Mexico (109,000), China (90,000) and Canada (35,000).
By race and ethnicity, more Asian immigrants than Hispanic immigrants have arrived in the U.S. each year since 2010. Immigration from Latin America slowed following the Great Recession, particularly from Mexico, which has seen net losses in U.S. immigration over the past few years.
Asians are projected to become the largest immigrant group in the U.S. by 2055, surpassing Hispanics. In 2065, Pew Research Center estimates indicate that Asians will make up some 38% of all immigrants, Hispanics 31%, whites 20% and blacks 9%.
 Is the immigrant population growing?
New immigrant arrivals have fallen, mainly due to a decrease in the number of unauthorized immigrants coming to the U.S. The fall in the growth of the unauthorized immigrant population can partly be attributed to more Mexican immigrants leaving the U.S. than coming in.
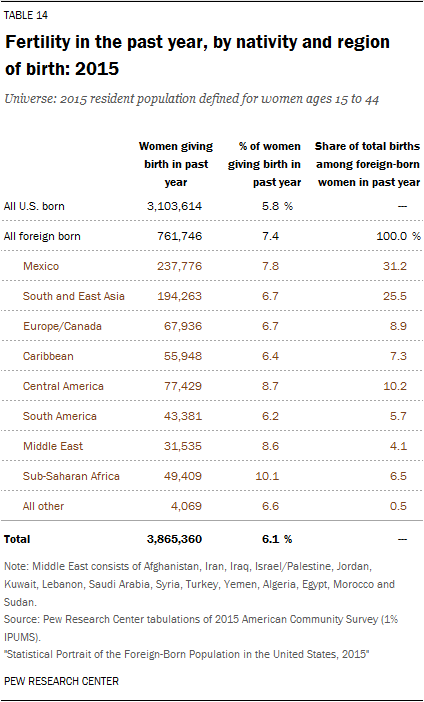
Looking forward, immigrants and their descendants are projected to account for 88% of U.S. population growth through 2065, assuming current immigration trends continue. In addition to new arrivals, U.S. births to immigrant parents will be important to future U.S. growth. In 2015, the percentage of women giving birth in the past year was higher among immigrants (7.4%) than among the U.S. born (5.8%). While U.S.-born women gave birth to over 3 million children that year, immigrant women gave birth to over 700,000.
How many immigrants have come to the U.S. as refugees?
Since the creation of the federal Refugee Resettlement Program in 1980,  about 3 million refugeeshave been resettled in the U.S – more than any other country.
In fiscal 2016, a total of 84,995 refugees were resettled in the U.S. The largest origin group of refugees was the Democratic Republic of the Congo, followed by Syria, Burma (Myanmar), Iraq and Somalia. Among all refugees admitted in that fiscal year, 38,901 are Muslims (46%) and 37,521 are Christians (44%). California, Texas and New York resettled nearly a quarter of all refugees admitted in fiscal 2016.
Where do most U.S. immigrants live?
Roughly half (46%) of the nation’s 43.2 million immigrants live in just three states: California (25%), Texas (11%) and New York (10%). California had the largest immigrant population of any state in 2015, at 10.7 million. Texas and New York had about 4.5 million immigrants each.
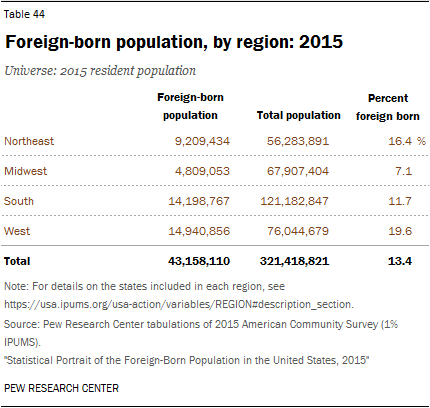
In terms of regions, about two-thirds of immigrants lived in the West (35%) and South (33%). Roughly one-fifth lived in the Northeast (21%) and 11% were in the Midwest.
In 2015, most immigrants lived in just 20 major metropolitan areas, with the largest populations in New York, Los Angeles and Miami. These top 20 metro areas were home to 27.9 million immigrants, or 65% of the nation’s total. Most of the nation’s unauthorized immigrant population lived in these top metro areas as well.
 How do immigrants compare with the U.S. population overall in education?
Immigrants in the U.S. as a whole have lower levels of education than the U.S.-born population. In 2015, immigrants were three times as likely as the U.S. born to have not completed high school (29% vs 9%). However, immigrants were just as likely as the U.S. born to have a college degree or more, 31% and 30% respectively.
 Educational attainment varies among the nation’s immigrant groups, particularly across immigrants from different regions of the world. Immigrants from Mexico (57%) and Central America (49%) are less likely to be high school graduates than the U.S. born (9%). On the other hand, immigrants from South and East Asia, Europe, Canada, the Middle East and sub-Saharan Africa were more likely than U.S.-born residents to have a bachelor’s or advanced degree.
Among all immigrants, those from South and East Asia (51%) and the Middle East (48%) were the most likely to have a bachelor’s degree or more. Immigrants from Mexico (6%) and Central America (9%) were the least likely to have a bachelor’s or higher.
How many immigrants are working in the U.S.?

In 2014, about 27 million immigrants were working in the U.S., making up some 17% of the total civilian labor force. Lawful immigrants made up the majority of the immigrant workforce at 19.5 million. An additional 8 million immigrant workers are unauthorized immigrants, a number little changed since 2009. They alone account for 5% of the civilian labor force.
Immigrants, regardless of legal status, work in a variety of different jobs, and do not make up the majority of workers in any U.S. industry. Lawful immigrants are most likely to be in professional, management, or business and finance jobs (37%) or service jobs (22%). Unauthorized immigrants, by contrast, are most likely to be in service (32%) or construction jobs (16%).
Immigrants are also projected to drive future growth in the U.S. working-age population through at least 2035. As the Baby Boom generation heads into retirement, immigrants and their children are expected to offset a decline in the working-age population by adding about 18 million people of working age between 2015 and 2035.
How well do immigrants speak English?

Among immigrants ages 5 and older, half (51%) are proficient English speakers – either speaking English very well (35%) or only speaking English at home (16%).
Immigrants from Mexico have the lowest rates of English proficiency (31%), followed by Central Americans (33%) and immigrants from South and East Asia (54%). Those from Europe or Canada (76%), sub-Saharan Africa (75%), and the Middle East (61%) have the highest rates of English proficiency.
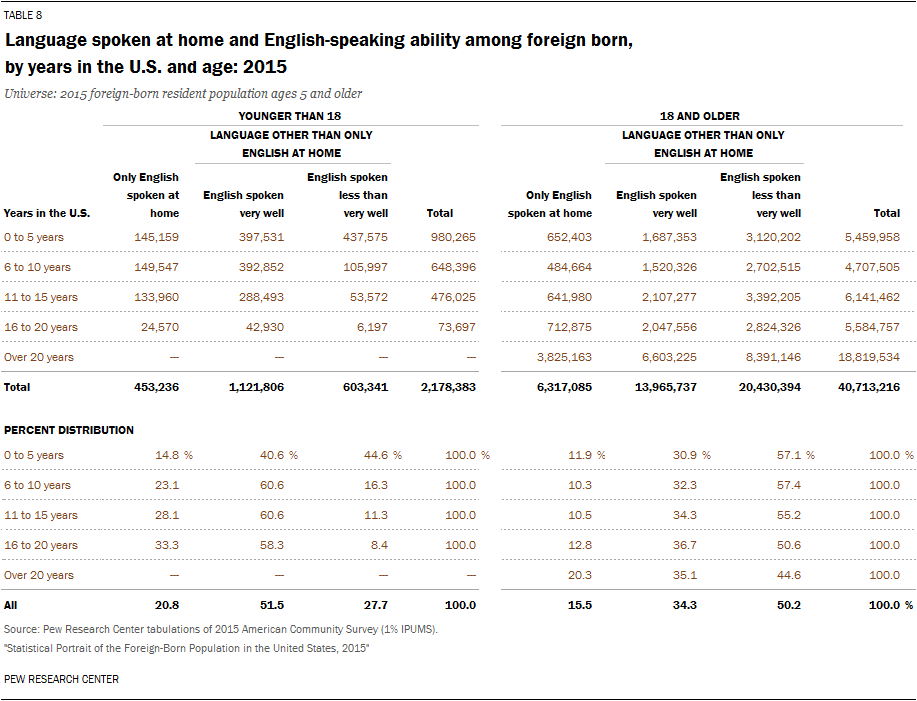
The longer immigrants have lived in the U.S., the greater the likelihood they are English proficient. Some 45% of immigrants living in the U.S. five years or less are proficient. By contrast, more than half (55%) of immigrants who have lived in the U.S. for 20 years or more are proficient English speakers.
Among immigrants ages 5 and older, Spanish is the most commonly spoken language. Some 44% of immigrants in the U.S. speak Spanish at home. The top five languages spoken at home among immigrants outside of Spanish are English only (16%), followed by Chinese (6%), Hindi (5%), Filipino/Tagalog (4%) and French (3%).
How many immigrants have been deported recently?
Around 344,000 immigrants were deported from the U.S. in fiscal 2016, slightly up since 2015. Overall, the Obama administration deported about 3 million immigrants between 2009 and 2016, a significantly higher number than the 2 million immigrants deported by the Bush administration between 2001 and 2008.
Immigrants convicted of a crime made up the minority of deportations in 2015, the most recent year for which statistics by criminal status are available. Of the 333,000 immigrants deported in 2015, some 42% had criminal convictions and 58% were not convicted of a crime. From 2001 to 2015, a majority (60%) of immigrants deported have not been convicted of a crime.
 How many immigrants are apprehended at the U.S.-Mexico border?
The number of apprehensions at the U.S.-Mexico border has sharply decreased over the past decade, from more than 1 million in fiscal 2006 to 408,870 in fiscal 2016. In the first two quarters of fiscal 2017, which started Oct. 1, there have been about 199,000 border patrol apprehensions at the Southwest border, compared with 186,000 for the same period in 2016. Today, more non-Mexicans than Mexicans are apprehended at the border. In fiscal 2016, the apprehensions of Central Americans at the border exceeded that of Mexicans for the second time on record.
How do Americans view immigrants and immigration?

While immigration has been at the forefront of a national political debate, the U.S. public holds a range of views about immigrants living in the country. Overall, a majority of Americans have positive views about immigrants. Six-in-ten Americans (63%) say immigrants strengthen the country “because of their hard work and talents,” while just over a quarter (27%) say immigrants burden the country by taking jobs, housing and health care.
Yet these views vary starkly by political affiliation. Among Democrats and Democratic-leaning independents, 82% think immigrants strengthen the country with their hard work and talents, and just 13% say they are a burden. Among Republicans and Republican-leaning independents, roughly as many (44%) say immigrants are a burden as say immigrants strengthen the country because of their hard work and talents (39%).
Americans also hold more positive views of some immigrant groups than others, according to a 2015 Pew Research Center immigration report. More than four-in-ten Americans expressed mostly positive views of Asian (47%) and European immigrants (44%), yet only a quarter expressed such views of African and Latin American immigrants (26% each). Roughly half of the U.S. public said immigrants are making things better through food, music and the arts (49%), but almost equal shares said immigrants are making crime and the economy worse (50% each).
Americans were divided on future levels of immigration. Nearly half said immigration to the U.S. should be decreased (49%), while one-third (34%) said immigration should be kept at its present level and just 15% said immigration should be increased.
Corrections: An earlier version of this post gave an incorrect figure for total deportations in fiscal year 2016. The text and its corresponding chart, “U.S. deportations of immigrants slightly up in 2016,” have been updated. Also, the chart “Mexico, China and India are top birthplaces for immigrants in the U.S.” has been updated to reflect the correct scale for figures. They are in millions. In addition, the note in a previous version of this chart incorrectly listed Mongolia as part of China.
TOPICS: EDUCATION, IMMIGRATION, IMMIGRATION TRENDS, POPULATION TRENDS, POPULATION GEOGRAPHY, BUSINESS AND LABOR, MIGRATION, ASIAN AMERICANS